Reports. Dashboards. Real-time data. Insights. There’s more online activity than ever before, and those of us in Digital Marketing are guilty of running around like Augustus Gloop in Willy Wonka’s amazing factory, gorging ourselves on reams of statistics and metrics of all kinds.
Shame on us.
We’ve allowed ourselves to become so enchanted by data that we’ve diluted the power of web analytics: deriving business value from data.
We’re better than this. It’s time we stepped up our game and started focusing on metrics that really matter; data that makes us (and our teams) smarter for noticing it.
Let’s go beyond Sessions and Page Views. Let’s measure more than Bounce Rate. Let’s stop talking about Impressions and Followers and Likes.
Let’s talk about these digital marketing metrics instead.
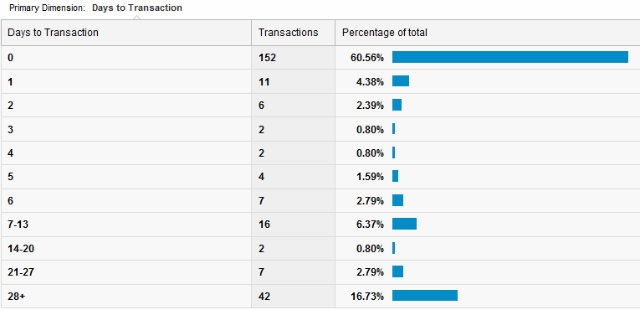
Time & Sessions to Outcome
How many visits does it take before a user completes your leadgen form? Or how many days from your first online interaction until a site visitor actually buys your product? This is crucial information!
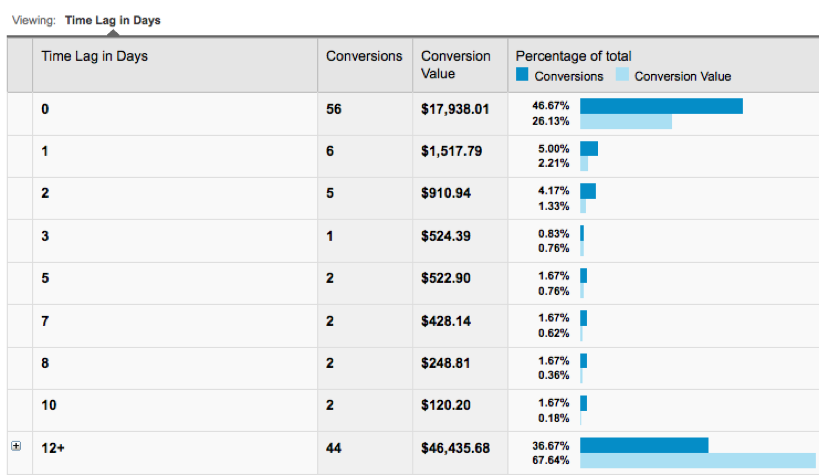
If getting someone to your website 3 times in 30 days provides the best conversion rate, it’s your job to get them to come back, and then come back again. This means you need to consider driving new visitors towards channels that will let you re-engage with them, such as downloading gated content or subscribing to your emails.
On the other hand, if your best conversion rate actually comes from new visitors, then maybe retargeting shouldn’t be your top priority, but display advertising and paid social should be heavily involved.
Adjusted Bounce Rate
Bounce rate is a commonly reported metric for measuring visitor engagement – but the way this metric is deployed in Google Analytics can be fundamentally flawed, and give a false understanding of how users are engaging with the site.
There are some fantastic articles penned about this topic, but the short version is that if a user lands on the site and never looks at another page, or takes a tracked action before leaving, that’s a bounce. Do you see the issue?
Bounce rate doesn’t tell you if people are engaging with your content!
One solution is an amendment to Google Analytics code that fires after a certain amount of time (10, 15, 30 seconds). Once this snippet fires, the visit will no longer be considered a bounce, even if they only look at one page.
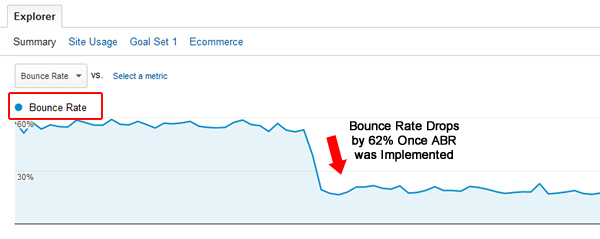
While this still isn’t a perfect solution, improving Bounce Rate to Adjusted Bounce means you will get a better sense of when people are reading and engaging with your content as opposed to landing, scrolling, and leaving.
Economic Value of Content
Would you like to know which of your blog posts, landing pages, whitepapers, videos or case studies are bringing the most value to your business? Of course. Because then you could focus your time on creating more of it!
This metric is both amazingly easy to put in place, yet also very difficult for most businesses to define. But stay with me – in Google Analytics, all you need to do is add a value to a goal, and that value will be distributed among visited pages prior to goal completion. Simple, right?
The challenge that most companies face is not the implementation of goal value, but determining what that goal value should be. (Hint: if you can’t tie the action to conversions, don’t track it as a Goal. Leave it as an Event or a Pageview.)
Here are the basic steps you’ll need to take in order to assign a monetary value to goals:
-
- Know (or figure out) the lifetime value (LTV) of a customer to your business.
- Determine the conversion rate of the Google Analytics goal in terms of customers.
- Multiply the profit from LTV in step #2 by the conversion rate in step #3. This is your goal value.
Let’s take XYZ Software Company, who has a free trial form on their website that converts to paying customers of their SaaS product 50% of the time, as an example. Their product charges $60 per month, and the average customer stays subscribed for 5 years
In this scenario, to get LTV we would multiply $60 x 60 months to get $3,600. Then, multiplying the LTV by the conversion rate of the form leads ($3,600 x 0.50) would result in $1,800 as the value of a form completion. We would put $1,800 into Google Analytics as the value of the goal completion.
Oh, and if you run an e-commerce business with no lead generation component? E-commerce tracking handles all of this value tracking for you. Score!
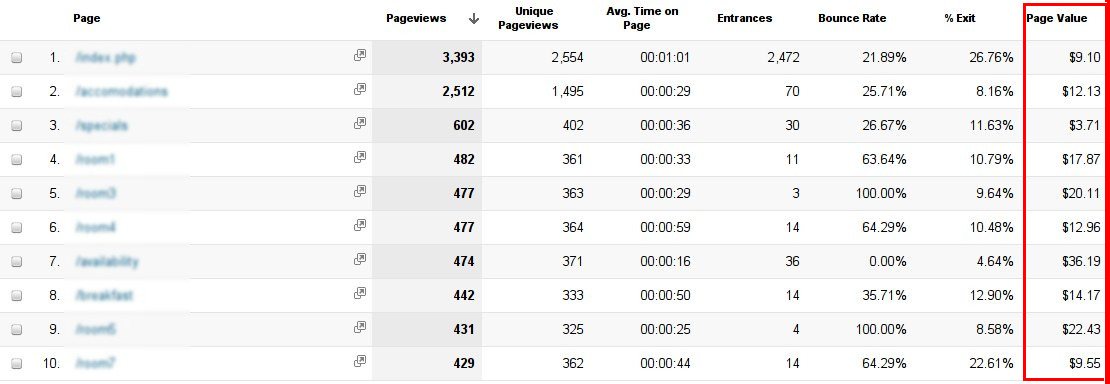
Once you’ve put values in for all of your goals and given time for them to record and track, you’ll be able to identify the most valuable pieces of content on your site, and adjust your content strategy accordingly.
Assisted Conversions & Rate
Similar to how Bounce Rate doesn’t tell the entire story, out-of-the-box Conversion Tracking often doesn’t give full insight into campaign performance. The standard attribution model in web analytics is based on the last actions before goal completion. This can lead to judgments about the effectiveness of marketing efforts that inaccurate and misinformed.
Assisted Conversions occur when a Source, Medium or Channel is involved in the process of a conversion, but isn’t the very last touchpoint. For example, a visitor who discovers you on Twitter and comes to your site, then gets retargeted, comes back to the site, and finally searches for your brand on Google before making a purchase. In standard Last Click attribution, Organic Search would get 100% of the conversion credit – but Assisted Conversions would give credit to Social and Display Advertising.
Check out this conversion attribution chart. With this Last Click data as your only point of reference, you might assume that Paid Search isn’t pulling its weight, especially compared to Referral and Organic Search.
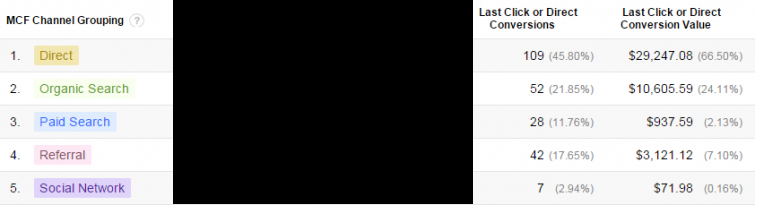
Now let’s include the entire picture, including Assisted Conversions. Pretty big difference, huh? Suddenly, Paid Search doesn’t look so bad.
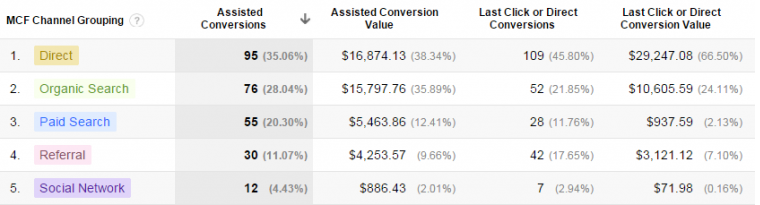
As if that wasn’t enough (and it definitely is), this report offers yet another awesome feature.
Check out the final column in the Assisted Conversion report – it shows a ratio of Assisted Conversions to Last Click Conversions.
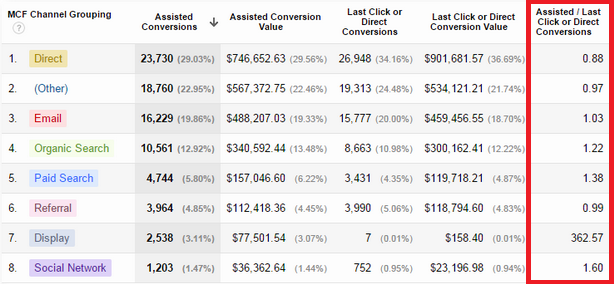
If that ratio is less than one, the channel is more likely to be the last step in the conversion funnel. If more than one, the channel tends to drive a lot of early-funnel visits that convert later via other channels.
This is huge! This single column in one report can give you massive insight into how you need to adjust your marketing campaigns to most effectively drive conversions by moving prospects through the purchase funnel. It can revolutionize your paid and organic content, your ad targeting, even your landing page design and experience.
Go Forth and Do Better Reporting
Reporting doesn’t have to be a morass of charts and graphs with no apparent end – we can take back web analytics. We can bring real value.
We must bring real value.
Your homework:
- If you aren’t tracking website goals, set them up. Today.
- Find out LTV for your company (there may be several, depending on the service/product you offer).
- Use LTV and conversion rate to put real dollar values to your website goals.
And more importantly, start paying attention to what matters – data that drives actionable insights.
Need some help getting your web analytics up-to-code, or just want an outside eye to make sense of the data? One of our Digital Specialists can help, just drop us a line.